Natural Gas Supply – Boom or Bubble?

We have heard two contrasting messages on natural gas supply this past month – one is that shale oil and gas is globally abundant, and the other is that shale gas is a bubble.  Which to believe?

By digging much deeper, the answer is “in between” and “depends on location”.

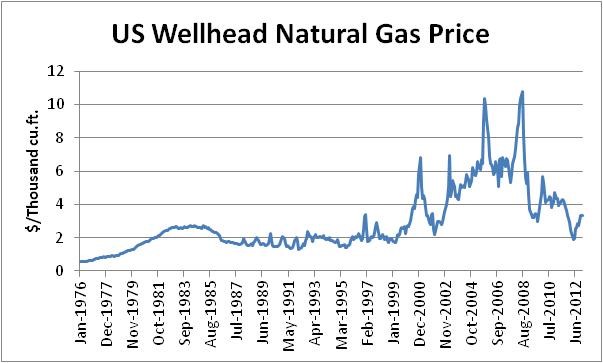
The volatility of natural gas supply and prices ($2 or $10?) is well known and makes it difficult to make investment choices (build LNG terminals/pipelines?  Natural gas cars and trucks?)


Figure1: Source EIA

Figure1: Source EIA


There is no question that North America is currently in a supply glut.  The relative low price of natural gas and the high storage inventories today is clear evidence of that.  But what about going forwards?  Will North America become Energy Independent and a net exporter of our low cost energy to the world?  Japan has paid as much as $18/MMBtu in 2012 for LNG vs $2-3 in North America wellhead NG (2012).

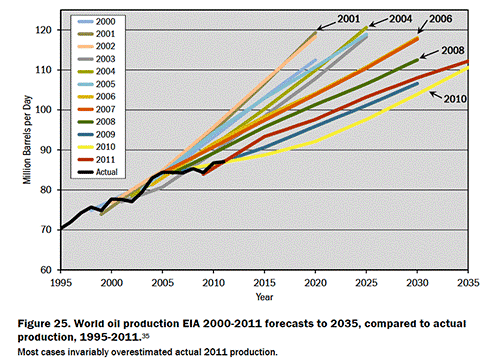
The EIA has updated their analysis on the amount of technically recoverable shale oil and gas as of June 2013, with the headline “Shale oil and shale gas resources are globally abundant”.  They are of course careful to differentiate between technically recoverable and economically recoverable, and that their update adds a modest 10% to the overall total.   The report is a gold mine for data.  At the same time the EIA has a poor track record of forecasting.


Figure2: Reference: Drill Baby Drill, shalebubble.org

Figure2: Reference: Drill Baby Drill, shalebubble.org


On the Bubble side of the argument, shalebubble.org has provided two reports analyzing the geological formations of the major US plays, the influence of Wall St., and the current state of the industry.  Their theme is diminishing returns + drilling treadmill + unsustainable prices + Wall St. enrichment = shale bubble.  Caveat Emptor (Buyer Beware).

So which to believe?  Clearly in some cases, with sweet spots and high quality plays, like the Marcellus field in Pennsylvania, there is abundant low cost natural gas.  Unfortunately, most of the rest of the plays are declining and uneconomic.  Massive writedowns and industry reticence on further broad shale investment are also telling.  Focused high quality plays are promising, but these are not in the majority.

Technology continues to improve what is technically recoverable and what is economically recoverable, though never as much as is desired, as the fundamentals of thermodynamics and geology are limiting.

Locally in BC, we have a relatively large potential supply of natural gas as compared to our demand, since we have so much hydroelectric power for our grid energy supply.  Exporting our natural gas to Asia seems a sure thing, as it is firmly part of both the BC Government and Industry plans, proximity to Asia, and not at the peak of any bubble situation like in some parts of the US, and does not have the very strong political opposition to oil sands pipelines like Keystone XL or Northern Gateway.


Figure3: Reference EIA

Figure3: Reference EIA


In summary, low price globally abundant natural gas is unlikely, with some local plays being good bets.

 

Organizing Clean Energy Complex Capital Projects

There are many similarities between Clean Energy Capital Projects (i.e. a new Clean Powerplant or Wind Farm) and Complex Engineered Product Systems which can benefit from the novel approaches to Global Project organization.

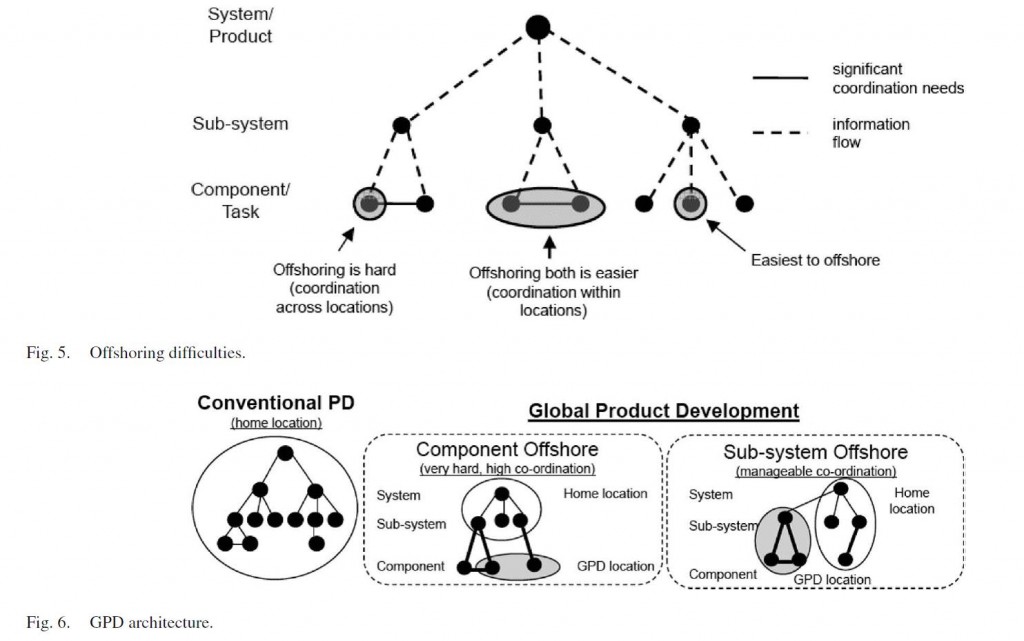
In the Global Product Development industry, a leading method to organize Complex Engineered Product Systems (i.e. aerospace, automotive, electronics) has been developed by Steven D. Eppinger, MIT.  He applies systems engineering methodology to complex product development by considering not only the technical aspects, but also the work and people aspects, and especially interactions and iteration between all three.  A good example of his work is noted in this paper, and he has written an excellent related book on his application of the analytical method Design Structure Matrix which has many case studies, including BMW and Pratt and Whitney.  An example diagram from his above paper discusses one aspect of the Global Application of Product Development:GPD

There is much more to his approach, with the above diagram “telling a thousand words”.

This same overall approach can also be applied to Clean Energy Capital Projects, as at the heart they are Complex Engineered Systems, even though most Clean Energy Capital Projects are not mass manufactured products and are often custom engineered for site, size, customer, environment, politics, etc.  Today and tomorrow’s Clean Energy Projects have to take into account so many more boundary conditions, interactions, water conservancy, failure modes and effect analysis, etc, that the systems engineering of the whole system, and how they fit into the bigger ecosystem continues to gain in complexity.  Down at the subsystem and component level, the supply chains, global sourcing, recyclability, and other aspects must also be organized considering global aspects.  Applying the Eppinger approach to Clean Energy Projects is likely to significantly improve the outcome any complex Clean Energy Project and of the client’s overall condition.


Reference: Organizing Global Product Development for Complex Engineered Systems IEEE Transactions on Engineering Management vol. 58, no. 3, pp. 510-529, August 2011. Anshuman Tripathy, Steven D. Eppinger


New Direction for US DOE: Energy Efficiency vs. Batteries and Biofuels


The previous US DOE Secretary Chu had the strategy “Batteries and Biofuels”.  That strategy has made some progress in those two areas in the past few years, but much less than planned.  Much of the US DOE investment in US Advanced Batteries has not turned out as well as planned, for example the recent demise of A123.  Biofuels have also have not had as much positive impact as planned, with issues such as “Food vs Fuel” or energy efficiency/balance, or environmental.

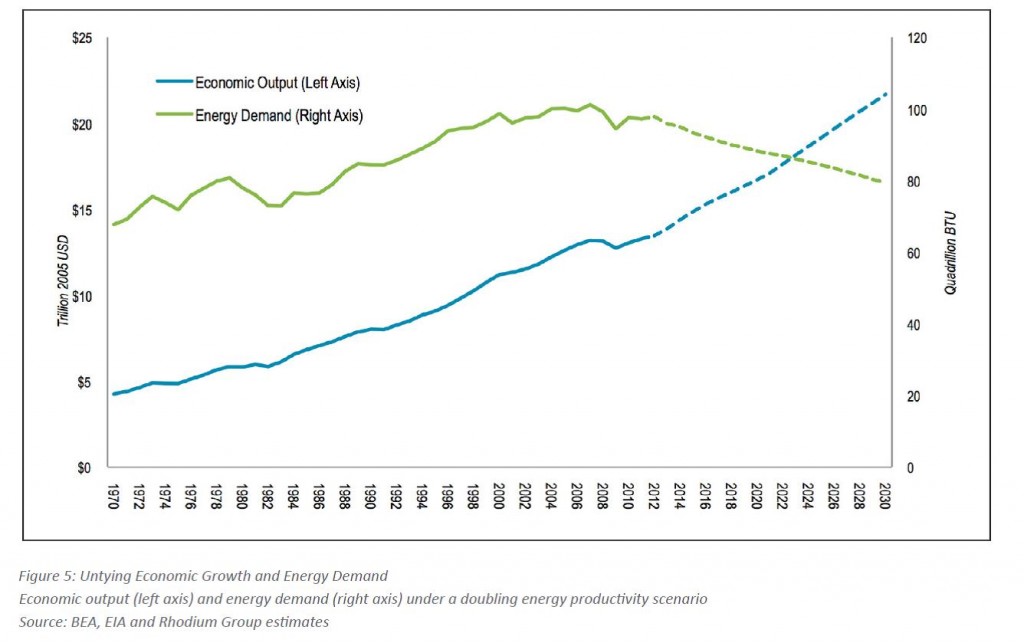
The new US DOE Secretary, Dr. Ernest Moniz, has stated that he wants to put Energy Efficiency “way, way up” on the US DOE priorities, and supports the Obama State of the Union goal of doubling US Energy productivity by 2030.  Achieving this goal is detailed in an expert commission in this report by the Alliance to Save Energy (ASE).

While the goal is ambitious, if it is even close to being realized, it will have a major impact on the US Energy landscape, and other regions will tend to follow as well.  In the figure below from the ASE report, in this scenario, the overall energy demand would drop while still increasing the US economic output.ASEreport

A drop in demand would have significant implications to new power projects, upgrades, infrastructure etc.

Going in the direction of increased energy efficiency has significant challenges but also promises some of the best investment returns of any opportunity with much lower risk.  While the topic of energy efficiency has waxed and waned over the years, this new emphasis by the US DOE looks like a much better strategy than the previous “Batteries and Biofuels” strategy.  Bravo!


Clean Energy Power Using the Elements of Hope


The Clean Energy industry depends on significant quantities of precious and rare earth materials, and if these power systems and vehicles were scaled to mass quantity levels, the demand would exceed economic supply.  China is the dominant mining source for rare earth metals, and has recently put in place yearly export quotas, which creates uncertainty in supply and raises prices.  An easy-to-read summary infographic by Vouchercloud connects Rare Earth materials, it uses, and sources (excerpt below).

excerpt

There are many industries that also use precious and rare earth metals – IT, Defence and Health – and this affects worldwide prices and supply.  Even iPhones contain significant amounts – and many consumers don’t recycle them, nor are their rare earth metals be recycled (check out this gorgeous infographic from 911Metallurgist on the iPhone).

If your Clean Energy product or project depends on rare and precious materials, the cost engineering prognosis is especially difficult as the material prices and supply have significant uncertainty, and recycling/reuse/remanufacturing has much longer timeframes than 18 month iPhones.  An automobile is typically on the road for 17 years before disposal and stationary power systems can be 30 years or longer.

A paper from Diederen defines which elements are ideal for Clean Energy, and calling them the “Elements of Hope” (example Fe, Al, Mg). Using the “Elements of Hope” in your product may safeguard you from material supply and cost risks, and potentially give you a competitive advantage.  These elements are likely to have the long term demand less than the economically practical supply.

It is possible to choose designs and materials from these elements, and the tradeoffs can overall be beneficial.  We give three examples:

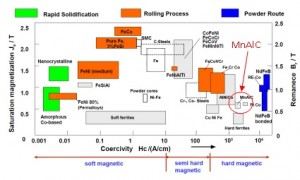
  1. Electric Motors: many electric motors today use neodymium or dysprosium.  Toyota has recently teamed Tesla to product an Induction Motor powertrain for the RAV4 EV to avoid these rare earth metals.  Even for strong permanent magnets is could be possible to not use rare metals:

    Figure 1: Reference Matthias Katter, "Industrial development of materials for sustainable development (magnets + magneto-caloric materials)", September 2009

    Figure 1: Reference Matthias Katter, “Industrial development of materials for sustainable development (magnets + magneto-caloric materials)”, September 2009

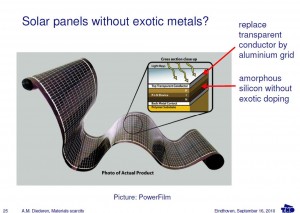
  2. Solar PV industry.Solar
  3. Fuel cell bipolar plates would either be carbon or metallic plates that use low cost material coating.

Your Clean Energy Power/Transportation Product/Project will have the best chance of success when the entire energy, value, recycle, and material chain is an integral part of the strategy, design, and planning process, using the most up to date methods.


Higher View to Electrical Energy Management Storage


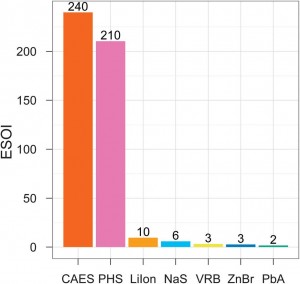
A recent study Barnhart and Benson introduces a new analytical method to quantify grid energy storage (hours vs. minutes) technologies, using a new metric ESOI (Energy Storage on Invested).  This metric considers round-trip efficiencies, lifetime, and the energy and material demands to manufacture the technology.  This metric can help predict costs.

Figure 1: ESOI for various energy storage technologies

Figure 1: ESOI for various energy storage technologies

Mechanical technologies like Compressed Air Energy Storage (CAES) or Pumped Hydro Storage (PHS) have a much higher ESOI than Electrochemical Technologies.  While mechanical technologies typically require geologic formations to provide potential energy storage (underground caverns for CAES or dams for PHS), there are several promising new start-ups developing technologies that are much easier to site: Gravity Power, SustainX, and Advanced Rail Energy Systems.

There is interest to take Li-ion batteries from the automotive industry and apply them to energy storage – either packaged arrays of new batteries or even used BEV batteries.  While the automotive and consumer industries are driving Li-ion batteries to higher power and energy densities, and lower costs, grid energy management storage also requires higher cycle life and high material availability to have a higher ESOI.

I like the new metric ESOI as it forces us to analyze technologies with the critical material and energy inputs in a systematic and quantifiable method, and can help compare alternate technologies.


Reference: Charles J. Barnhart and Sally M. Benson (2013) On the importance of reducing the energetic and material demands of electrical energy storage. Energy Environ. Sci., doi: 10.1039/C3EE24040A