Why Are Risk Assessments So Underestimated?

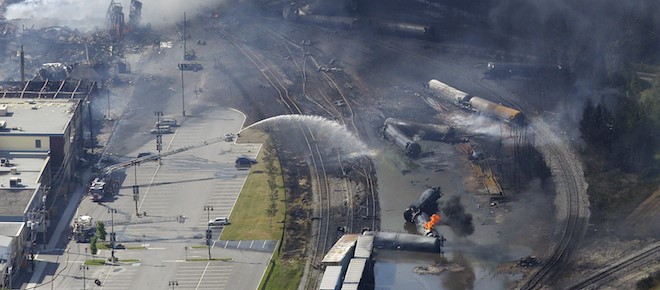
In light of the terrible train derailment tragedy in La Megantic this week, one question is “why are risk assessments so underestimated?”

Figure 1: Train Derailment Consequences La Megantic July 2013

Figure 1: Train Derailment Consequences La Megantic July 2013


Engineers, scientists, and managers do risk assessments all the time as a normal course of business.  Yet system failures occur much more frequently than the risk assessments report.

Typical Nuclear power industry/regulator estimates of core damage frequency are between 1 in 20,000 or 1 in 50,000 reactor years, which mean a core damage incidence every 40-100 years; or in our history, there should have been less than 1 incidence so far.  Yet so far we have had more than 10 such incidents.  The risk assessment and management methodology in this case is underestimating the risk by over an order of magnitude.

While it is too early still to understand the root cause and systemic failures in the La Megantic train derailment, clearly the risks were underestimated.  The appropriate safeguards – design or human – failed.

There are many risk assessment techniques used by industry and regulators: Failure Modes and Effects Analysis, Probabilistic Risk Assessment, and Hazard and Operability Study (to name a few).   Where they tend to underestimate risk has been studied by many independent sources* and has been found to be especially weak in human factors:

  • complacency in design
  • failure to anticipate vulnerabilities from external sources to the system
  • unjustified trust in safety margins
  • poor training
  • cutting corners to cut costs
  • cosy relationship between regulators and the regulated
  • cultural factors
  • handovers between individuals or groups from different organizations

Hollywood likes to produce action/disaster movies that illustrate the consequences of accidents and incidents.  Sometimes they are overdramatic (the fuel cell explosion in Terminator 3 was like a huge nuclear bomb!  If only fuel cells could be so powerful…).


Figure 2: Fuel cell explosion (!) in Terminator 3

Figure 2: Fuel cell explosion (!) in Terminator 3


Other times Hollywood seems to be pretty prescient, as in the movie Unstoppable, though that had a happy ending.

Considering the catastrophic consequences of the La Megantic derailment, we need to reconsider oil transport – and not necessarily in favour of pipelines, as pipelines have their unique risks and consequences as well.  The La Megantic derailment is bad for oil overall.

One advantage of many clean energy sources is that the inherent accident risk and consequences are much lower than conventional forms.  When assessed through that lens, the overall project and financial returns can be superior.


* Contact me for links


Open Source Thermodynamic Process Simulator Review – DWSIM

Many complex energy systems use thermodynamic process simulators for systems design, especially if fueled by oil, natural gas, methanol, hydrogen or landfill gas.   The leading industry simulators are Aspen HysysProSim, and VMGSim.   These simulators are very powerful, as they can model very complex chemical and biological reactions, networks of unit operations with many interactions requiring multivariable convergence, and both steady-state and dynamic control systems.  As they provide significant value, especially to Oil and Gas, the license fees per seat are on the order of $10,000/year.

Open Source software continues to gain traction with consumers; for example OpenOffice has approximately between 10-20% of the market, with Microsoft Office being most of the rest.   Could there be a viable Open Source alternative for thermodynamic process simulators, given the smaller market and similar software complexity?

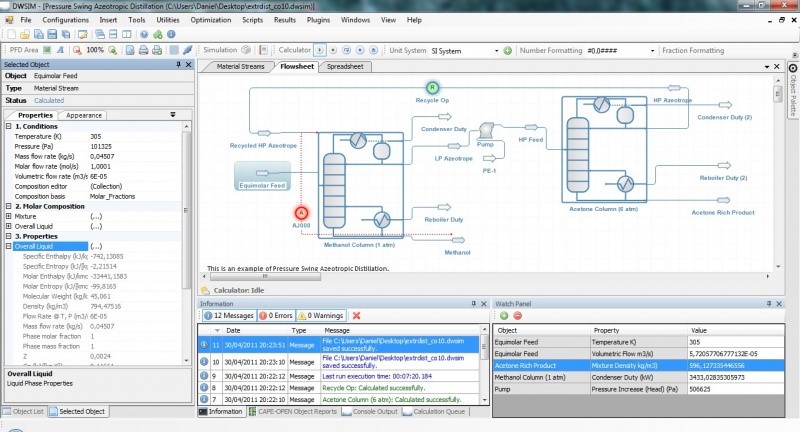
DWSIM is the only real Open Source thermodynamic simulator with a very similar capability to the steady-state versions of Hysys, ProSim or VMGSim, including a graphical flowsheet and integrated spreadsheet.

Figure 1: DWSIM User Interface

Figure 1: DWSIM User Interface


I have recently used both the latest versions of a leading industry thermodynamic process simulator and DWSIM.  I am impressed with DWSIM, and I am currently productive with this tool.  It has the core functionality for steady-state mass and energy balances, and is powerful enough to examine part power and start-up states.  It is easy to use, easy to report, and convergence times are good.  While it does not have dynamic capability, nor is that capability on the author’s roadmap, the vast majority of studies for most users are done in steady-state mode.  The overall support materials are good.  One advantage of being open source is that the underlying engine and calculations can be more transparent to the user, so for some that can be good for learning and checking.

Every process simulator has its own learning curve because they all have somewhat different convergence routines and architecture, and especially for converging very complex networks, so to become truly productive will require some time investment.  I have simulated high complexity systems in DWSIM so far, and overall it works fine.

The author, Daniel Medeiros, is currently active and planning further releases, which means the product will continue to improve.

For many users, such as students, or some small businesses, part-time practitioners, or those that need primarily the core functionality only, DWSIM is a great choice.  So far the big industry players with proprietary software do not offer light versions of their software for lower costs, so there is a demand for packages like DWSIM for this end of the market.  DWSIM has the “first-mover” Open Source advantage, and can set the standard in this segment of the market, and will take some of this market from the big players.

Overall, I am pleased with the product for what it is.  For most large companies, the industry leading simulators are an overall better value proposition, because of the higher power and features.  For the other end of the market, DWSIM is well worth trying, or may be the only economic option.

Natural Gas Supply – Boom or Bubble?

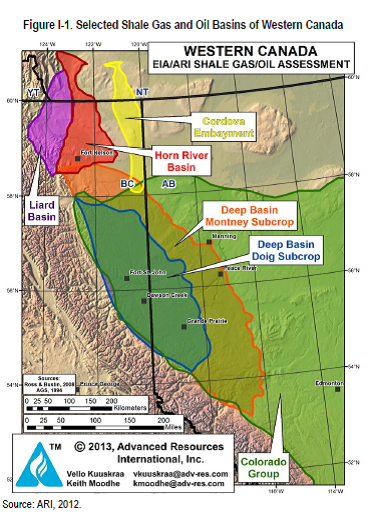
We have heard two contrasting messages on natural gas supply this past month – one is that shale oil and gas is globally abundant, and the other is that shale gas is a bubble.  Which to believe?

By digging much deeper, the answer is “in between” and “depends on location”.

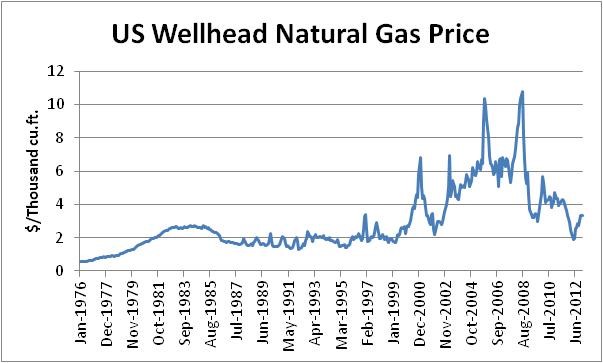
The volatility of natural gas supply and prices ($2 or $10?) is well known and makes it difficult to make investment choices (build LNG terminals/pipelines?  Natural gas cars and trucks?)


Figure1: Source EIA

Figure1: Source EIA


There is no question that North America is currently in a supply glut.  The relative low price of natural gas and the high storage inventories today is clear evidence of that.  But what about going forwards?  Will North America become Energy Independent and a net exporter of our low cost energy to the world?  Japan has paid as much as $18/MMBtu in 2012 for LNG vs $2-3 in North America wellhead NG (2012).

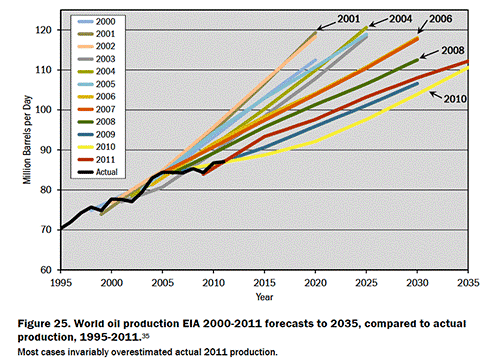
The EIA has updated their analysis on the amount of technically recoverable shale oil and gas as of June 2013, with the headline “Shale oil and shale gas resources are globally abundant”.  They are of course careful to differentiate between technically recoverable and economically recoverable, and that their update adds a modest 10% to the overall total.   The report is a gold mine for data.  At the same time the EIA has a poor track record of forecasting.


Figure2: Reference: Drill Baby Drill, shalebubble.org

Figure2: Reference: Drill Baby Drill, shalebubble.org


On the Bubble side of the argument, shalebubble.org has provided two reports analyzing the geological formations of the major US plays, the influence of Wall St., and the current state of the industry.  Their theme is diminishing returns + drilling treadmill + unsustainable prices + Wall St. enrichment = shale bubble.  Caveat Emptor (Buyer Beware).

So which to believe?  Clearly in some cases, with sweet spots and high quality plays, like the Marcellus field in Pennsylvania, there is abundant low cost natural gas.  Unfortunately, most of the rest of the plays are declining and uneconomic.  Massive writedowns and industry reticence on further broad shale investment are also telling.  Focused high quality plays are promising, but these are not in the majority.

Technology continues to improve what is technically recoverable and what is economically recoverable, though never as much as is desired, as the fundamentals of thermodynamics and geology are limiting.

Locally in BC, we have a relatively large potential supply of natural gas as compared to our demand, since we have so much hydroelectric power for our grid energy supply.  Exporting our natural gas to Asia seems a sure thing, as it is firmly part of both the BC Government and Industry plans, proximity to Asia, and not at the peak of any bubble situation like in some parts of the US, and does not have the very strong political opposition to oil sands pipelines like Keystone XL or Northern Gateway.


Figure3: Reference EIA

Figure3: Reference EIA


In summary, low price globally abundant natural gas is unlikely, with some local plays being good bets.


Organizing Clean Energy Complex Capital Projects

There are many similarities between Clean Energy Capital Projects (i.e. a new Clean Powerplant or Wind Farm) and Complex Engineered Product Systems which can benefit from the novel approaches to Global Project organization.

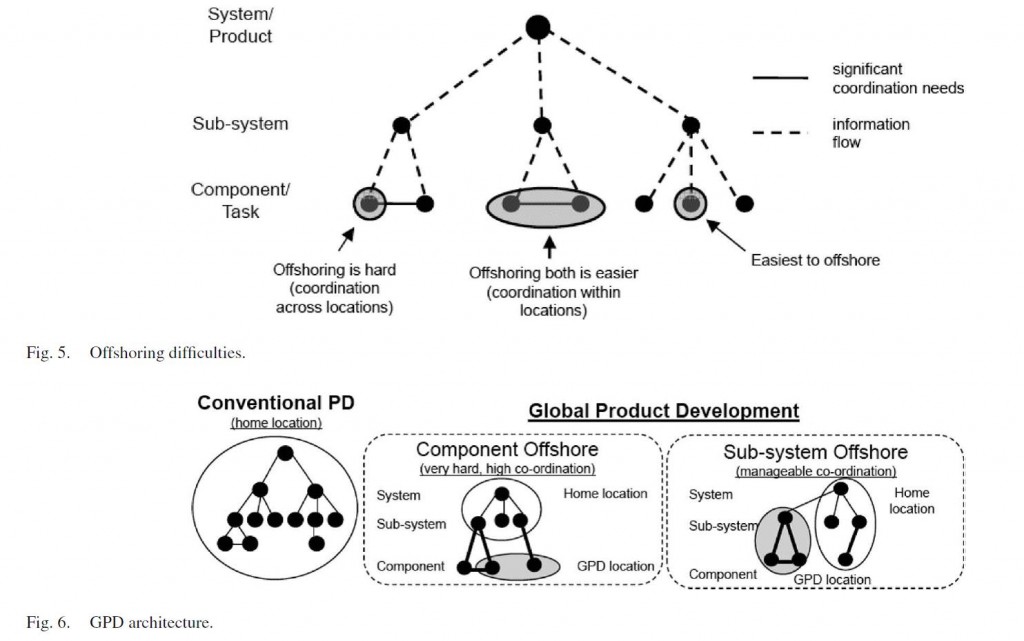
In the Global Product Development industry, a leading method to organize Complex Engineered Product Systems (i.e. aerospace, automotive, electronics) has been developed by Steven D. Eppinger, MIT.  He applies systems engineering methodology to complex product development by considering not only the technical aspects, but also the work and people aspects, and especially interactions and iteration between all three.  A good example of his work is noted in this paper, and he has written an excellent related book on his application of the analytical method Design Structure Matrix which has many case studies, including BMW and Pratt and Whitney.  An example diagram from his above paper discusses one aspect of the Global Application of Product Development:GPD

There is much more to his approach, with the above diagram “telling a thousand words”.

This same overall approach can also be applied to Clean Energy Capital Projects, as at the heart they are Complex Engineered Systems, even though most Clean Energy Capital Projects are not mass manufactured products and are often custom engineered for site, size, customer, environment, politics, etc.  Today and tomorrow’s Clean Energy Projects have to take into account so many more boundary conditions, interactions, water conservancy, failure modes and effect analysis, etc, that the systems engineering of the whole system, and how they fit into the bigger ecosystem continues to gain in complexity.  Down at the subsystem and component level, the supply chains, global sourcing, recyclability, and other aspects must also be organized considering global aspects.  Applying the Eppinger approach to Clean Energy Projects is likely to significantly improve the outcome any complex Clean Energy Project and of the client’s overall condition.


Reference: Organizing Global Product Development for Complex Engineered Systems IEEE Transactions on Engineering Management vol. 58, no. 3, pp. 510-529, August 2011. Anshuman Tripathy, Steven D. Eppinger


New Direction for US DOE: Energy Efficiency vs. Batteries and Biofuels


The previous US DOE Secretary Chu had the strategy “Batteries and Biofuels”.  That strategy has made some progress in those two areas in the past few years, but much less than planned.  Much of the US DOE investment in US Advanced Batteries has not turned out as well as planned, for example the recent demise of A123.  Biofuels have also have not had as much positive impact as planned, with issues such as “Food vs Fuel” or energy efficiency/balance, or environmental.

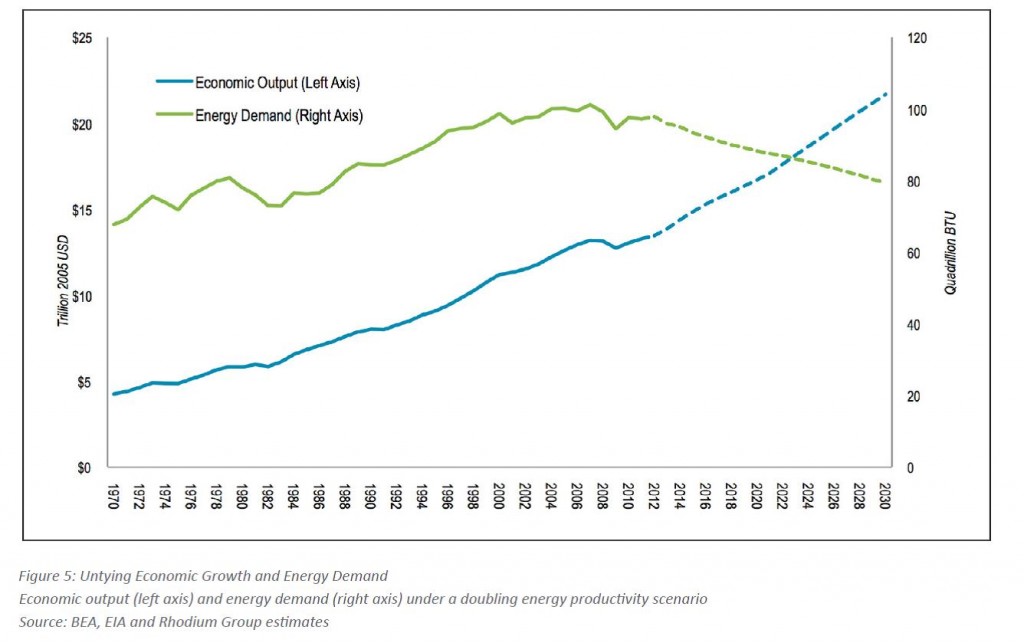
The new US DOE Secretary, Dr. Ernest Moniz, has stated that he wants to put Energy Efficiency “way, way up” on the US DOE priorities, and supports the Obama State of the Union goal of doubling US Energy productivity by 2030.  Achieving this goal is detailed in an expert commission in this report by the Alliance to Save Energy (ASE).

While the goal is ambitious, if it is even close to being realized, it will have a major impact on the US Energy landscape, and other regions will tend to follow as well.  In the figure below from the ASE report, in this scenario, the overall energy demand would drop while still increasing the US economic output.ASEreport

A drop in demand would have significant implications to new power projects, upgrades, infrastructure etc.

Going in the direction of increased energy efficiency has significant challenges but also promises some of the best investment returns of any opportunity with much lower risk.  While the topic of energy efficiency has waxed and waned over the years, this new emphasis by the US DOE looks like a much better strategy than the previous “Batteries and Biofuels” strategy.  Bravo!


The Four Key Ingredients to a Successful Clean Energy Innovation Cluster in Vancouver/BC


Vancouver/BC has become a leading Clean Energy Innovation Cluster in several Technologies/Industries, despite many challenges:

  • smaller transportation/power industry and energy innovation ecosystem compared to many other regions, especially in the US, Japan, Korea, China, and Germany.
  • relatively low needs for Clean Energy applications compared to other regions because of lower energy prices, lower pollution, and a smaller market
  • higher cost of living for employees


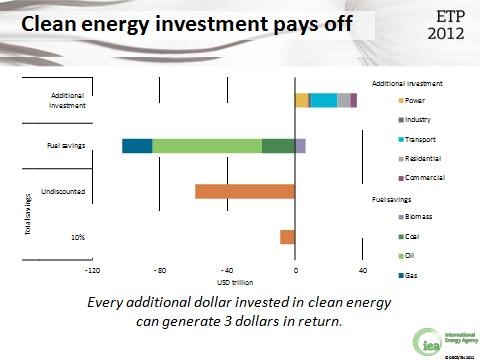
The medium and long term Policy and Business Case for Clean Energy is compelling, according to the IEA, and is summarized in their IEA Energy Technology Perspectives 2012. A summary excerpt chart is below:IEA_perspectives_2012

Governments and Industry worldwide are collaborating and competing for business, projects, and products, and Clean Energy clusters are a big part of that.


Within the Vancouver/BC Cluster, examples of world leading Clean Energy technology companies in Vancouver include Westport, Ballard, and AFCC/Mercedes-Benz Fuel Cell.  These companies are all acknowledged global world leaders in their sector, and all continue to attract significant Foreign Direct Investment from big OEM multinationals.  There are many emerging or established small Clean Energy companies in Vancouver as well – dPoint Technologies, Endurance Wind Power, and Greenlight Innovation – to name a few.  The BC Energy companies, such as BC Hydro or Fortis, are players in many Clean Energy projects.  The BC Consulting Engineering companies all have Clean Energy services.  The BC Government has laid out a near term strategy, including a recent focus on LNG (which is one of the cleaner fossil fuels, though still has a medium carbon intensity).


So, what are the four key ingredients for Vancouver/BC?

  1. World-leading technology/product prototypes and projects, which must be decisively better and more competitive than competing technologies, product prototypes, or projects from companies in other regions.
    1. For technologies/products, in the critical OEM/customer prototype evaluation phase, the prototypes must demonstrate a superior performance and high robustness to real-world usage profiles; as well as a pathway to cost effectiveness and high volume manufacturability.  Though high-volume, low-cost manufacturing is not a typical fit for Vancouver, as it is more likely to be done in other regions and closer to the customer deployment regions; proving technology readiness can be easily done in Vancouver.
    2. Clean Energy Projects need to meet or beat the project intent – on time and on budget – and use the best Project Management, Engineering and Construction techniques, while navigating the complexities of stakeholders, the public, and politics.

Though self-evident the most critical ingredient is the competition.  The core technology/product/project in Vancouver/BC must be extra competitive to prevent the host OEM/funding organization from doing the development in their backyard, or with their own internal resources.

  1. Target worldwide export markets, as the needs for Clean Energy technologies/products are higher in other regions (energy prices, availability, and pollution).  The challenge of finding early applications in BC forces the Clean Energy industry to study the worldwide market and partner with strong companies from other regions – US, Germany, China, Japan, etc. to bring applications, help, and funding.  By being export focused, it can also strengthen the development/project team in comparison to teams in other regions, since challenge breeds character.
  1. Build on Vancouver and BC’s strengths, especially in technology innovation, and where there is a critical mass of expertise or a strong competitive advantage; such as natural gas, hydro, environmental protection, energy management and power electronics, or PEM fuel cells.  The Globe Foundation has summarized many of BC’s strengths in this 2010 report.  Trying to catch up in areas where Vancouver/BC is not as strong is not practical, as noted in research by Pisano and Shih in this Harvard Business Review Article.  For positive examples that Vancouver/BC should consider, in the USA, there are several cities that are clearly specializing in clusters, according to this article, such as Indianapolis in Life Sciences or San Antonio in Cybersecurity.
  1. Improved partnering between industry and government.  Canada is well known for its supply of resources to global markets, and for its small-scale innovation.  However, Canada does not have nearly as much success in turning innovative technology into global products, as it has just a handful of world leaders in other industries (for example: Bombardier or Blackberry). Collaboration is needed between industry and government in Clean Energy because of the high capital requirements, risks, regulations, and long timeframes. Canada and BC can especially build on other regions that have strongly supported their clusters with:
    1. Long term strategic policy support and National/Provincial strategies similar to Germany, Japan, Korea, and California (i.e. Roadmaps and Policy requirements through 2050)
    2. Procurement and demonstration of competitive BC/Canadian technologies/products to fill new needs where they make sense.
    3. Funding support through the gap between technology and commercial launch, such as from SDTC or BDC.
    4. More industry “pull” mechanisms on University/College Research and Student-Industry placement (i.e. through NSERC, NRC, Policy etc), similar to Germany and Japan

In closing, Clean Energy is a both a collaborative and a fiercely competitive sector; and with the right strategy, Vancouver/BC developers can be successful players.


Clean Energy Power Using the Elements of Hope


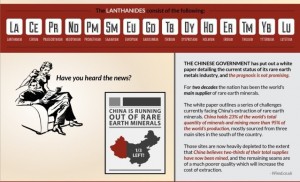
The Clean Energy industry depends on significant quantities of precious and rare earth materials, and if these power systems and vehicles were scaled to mass quantity levels, the demand would exceed economic supply.  China is the dominant mining source for rare earth metals, and has recently put in place yearly export quotas, which creates uncertainty in supply and raises prices.  An easy-to-read summary infographic by Vouchercloud connects Rare Earth materials, it uses, and sources (excerpt below).

excerpt

There are many industries that also use precious and rare earth metals – IT, Defence and Health – and this affects worldwide prices and supply.  Even iPhones contain significant amounts – and many consumers don’t recycle them, nor are their rare earth metals be recycled (check out this gorgeous infographic from 911Metallurgist on the iPhone).

If your Clean Energy product or project depends on rare and precious materials, the cost engineering prognosis is especially difficult as the material prices and supply have significant uncertainty, and recycling/reuse/remanufacturing has much longer timeframes than 18 month iPhones.  An automobile is typically on the road for 17 years before disposal and stationary power systems can be 30 years or longer.

A paper from Diederen defines which elements are ideal for Clean Energy, and calling them the “Elements of Hope” (example Fe, Al, Mg). Using the “Elements of Hope” in your product may safeguard you from material supply and cost risks, and potentially give you a competitive advantage.  These elements are likely to have the long term demand less than the economically practical supply.

It is possible to choose designs and materials from these elements, and the tradeoffs can overall be beneficial.  We give three examples:

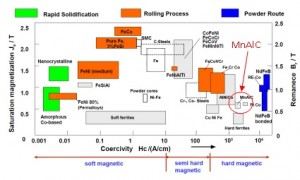
  1. Electric Motors: many electric motors today use neodymium or dysprosium.  Toyota has recently teamed Tesla to product an Induction Motor powertrain for the RAV4 EV to avoid these rare earth metals.  Even for strong permanent magnets is could be possible to not use rare metals:

    Figure 1: Reference Matthias Katter, "Industrial development of materials for sustainable development (magnets + magneto-caloric materials)", September 2009

    Figure 1: Reference Matthias Katter, “Industrial development of materials for sustainable development (magnets + magneto-caloric materials)”, September 2009

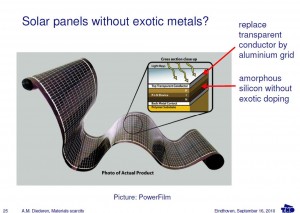
  2. Solar PV industry.Solar
  3. Fuel cell bipolar plates would either be carbon or metallic plates that use low cost material coating.

Your Clean Energy Power/Transportation Product/Project will have the best chance of success when the entire energy, value, recycle, and material chain is an integral part of the strategy, design, and planning process, using the most up to date methods.


Higher View to Electrical Energy Management Storage


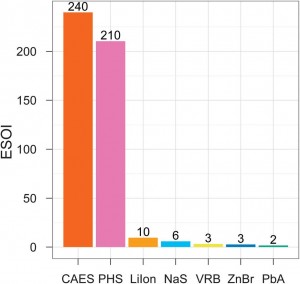
A recent study Barnhart and Benson introduces a new analytical method to quantify grid energy storage (hours vs. minutes) technologies, using a new metric ESOI (Energy Storage on Invested).  This metric considers round-trip efficiencies, lifetime, and the energy and material demands to manufacture the technology.  This metric can help predict costs.

Figure 1: ESOI for various energy storage technologies

Figure 1: ESOI for various energy storage technologies

Mechanical technologies like Compressed Air Energy Storage (CAES) or Pumped Hydro Storage (PHS) have a much higher ESOI than Electrochemical Technologies.  While mechanical technologies typically require geologic formations to provide potential energy storage (underground caverns for CAES or dams for PHS), there are several promising new start-ups developing technologies that are much easier to site: Gravity Power, SustainX, and Advanced Rail Energy Systems.

There is interest to take Li-ion batteries from the automotive industry and apply them to energy storage – either packaged arrays of new batteries or even used BEV batteries.  While the automotive and consumer industries are driving Li-ion batteries to higher power and energy densities, and lower costs, grid energy management storage also requires higher cycle life and high material availability to have a higher ESOI.

I like the new metric ESOI as it forces us to analyze technologies with the critical material and energy inputs in a systematic and quantifiable method, and can help compare alternate technologies.


Reference: Charles J. Barnhart and Sally M. Benson (2013) On the importance of reducing the energetic and material demands of electrical energy storage. Energy Environ. Sci., doi: 10.1039/C3EE24040A